

Every second of load time costs money, and in 2026 the data behind that statement is clearer than ever. This piece looks at the site speed impact on conversion, drawing on the latest performance benchmarks to show exactly where slow-loading pages are costing sales, and what practical fixes actually move the needle in 2026.
In this article:
What Is a Web Page’s Conversion Rate?
A web page’s conversion rate is the percentage of visitors who complete a desired action after landing on that page. That action could be making a purchase, submitting a form, subscribing to a newsletter, or booking a call, depending on the website’s main goals.
The formula is simple:
Conversion Rate = (Number of Conversions ÷ Total Visitors) × 100
For example, if a landing page gets 1,000 visitors in a month and 23 of them complete a purchase, the conversion rate is 2.3%.
2.3 = (23 ÷ 1,000) x 100
Average Website Conversion Rates
Average conversion rates depend on the industry sector and whether a website is B2B or B2C. However, as a top-level benchmark, the average conversion rate for a contact form submission on a B2B website in 2026 is 2.4%, with high performers achieving 5.0%+.
As for B2C e-commerce businesses, the average rate documented by Statista in the first quarter of 2026 was 1.4%, with industries such as food & beverage and beauty reaching up to 2.4%.
How Does Site Speed Affect Conversion Rates?
When load time increases from 1 second to 3 seconds, the probability of a user bouncing (leaving before the page even finishes loading) increases by 32%. That’s nearly a third of your potential customers gone before they’ve even seen your products or services.
Every extra second, impatience compounds, giving visitors another moment to reconsider, get distracted, or hit the back button. Speed signals credibility. A high-performing, responsive site gets visitors where they want to go – fast.
A slow one raises doubt before a single word of copy has been read.
What’s the Average Website Speed in 2026?
The average desktop speed in 2026 is 2.5 seconds, while mobile averages a shocking 8.6 seconds. This highlights a huge opportunity to uplevel your site’s mobile performance above your competitors’ and reclaim leaking revenue.
The Speed-Conversion Relationship: What the Research Shows
Google’s Research on Bounce Probability
If the 32% statistic wasn’t enough, Google’s research shows that the bounce rate increases to 90% when a website’s load time goes from 1 to 5 seconds on mobile. That’s traffic you’ve already paid for through ads, SEO, or marketing, gone.
Akamai’s Study: Milliseconds Matter
Another study by Akamai found that even a 100-millisecond delay in website load time can reduce conversion rates by 7%.
To put that in perspective, if you’re running an e-commerce store generating £50,000 a month, a single, barely perceptible delay of one-tenth of a second could be quietly costing you £3,500 of that revenue every month.
Nitropack & Google: 60% More Page Visits
According to a study carried out by Nitropack and Google, visitors who experienced a load time of less than 3 seconds visited 60% more pages on sites. In terms of your business, more pages browsed means more chances to discover products, read reviews, hit an offer, or land on the exact page that convinces someone to buy.
Google AdSense Insights: Mobile Abandonment
Google recommends that businesses take action to improve mobile speed, after finding that up to 53% of visits can be abandoned if your site takes longer than 3 seconds to load. As mobile traffic accounted for 52.27% of web traffic in the first quarter of 2026, slow load times could be cutting your audience in half before a single visitor even sees your site.
Studies on Revenue Uplift: Wharton Research
A study by Wharton found that a 10% decrease in a website’s speed can reduce conversion rates by 2% and sales by 4.2%. This 2% drop in conversion rate has a knock-on effect that’s easy to underestimate.
For example, take a store with 50,000 monthly visitors converting at 3%, that’s 1,500 orders a month. A 2% decrease brings the conversion rate down to 2.94%, which may seem negligible on paper but translates to 30 fewer orders each month.
At a £60 average order value, that’s £1,800 in lost revenue monthly, or £21,600 a year, and that’s before accounting for repeat purchases, referrals, or reviews those 30 customers might have generated.
What makes this figure worth noting is how it scales…
A 2% conversion rate drop costs a small store with 50,000 monthly visitors around $21,600 a year, a manageable but real loss. But that exact same 2% drop, applied to a larger e-commerce brand doing 500,000 monthly visitors at a slightly higher average order value of £85, works out to over £300,000 a year.
B2B Vs B2C E-commerce Sites: Difference in Impact
While the data makes it clear that speed affects both B2B and B2C sites, the scale of that impact looks different depending on which side of the fence you sit on. A general benchmark study found that the average conversion rate for B2B websites (all actions) is 2.23%, compared to 2.86% for B2C e-commerce businesses.
However, a study by Portent found the effect on B2B websites is often more dramatic in percentage terms: a site that loads in 1 second converts at three times the rate of a 5-second site and five times the rate of a 10-second site. For B2C e-commerce, sites that load in 1 second were found to have e-commerce conversion rates 2.5x higher than those that load in 5 seconds and 1.5x higher than those that load in 10 seconds. However, it is noted that this could be down to the smaller sample size used in the 10-second round.
Can Slow Site Speed Cause Cart Abandonment?
Yes, slow site speed can cause cart abandonment. B2C shoppers tend to be more impulsive and have lower patience thresholds, so speed issues show up fastest as immediate bounces and abandoned carts rather than a slow erosion of trust over a longer research cycle. B2C loses visitors in seconds, while B2B loses deals over days or weeks, but in both cases, the businesses that fix their site speed convert meaningfully more of the traffic they’ve already worked hard to earn.

What Other Factors Affect Conversion Rate Besides Speed?
Speed is a powerful lever, but it’s not the only one. Even a lightning-fast site can convert poorly if other fundamentals are working against it, and it’s worth being upfront about that so this article doesn’t overstate speed’s role in isolation. These factors include:
- Trust signals: Think SSL certificates, security badges, clear return policies, real customer reviews, and recognisable payment logos all reduce the hesitation that stops someone completing a purchase, regardless of how fast the page loaded.
- Checkout complexity: A slow site that leads to a fast, simple checkout will often outperform a fast site with a clunky, multi-step checkout full of unnecessary form fields. Every extra field, login requirement, or unclear step is a fresh opportunity for someone to abandon.
- Pricing and perceived value: No amount of speed optimisation will fix a page where the price feels unjustified, the benefits are not clearly communicated, or shipping costs appear as a surprise at the last step. With each of these, a competitor may be offering a better deal just a click away.
- Copy and messaging clarity: If visitors can’t quickly understand what you’re offering, why it matters to them, and what to do next, they’ll leave, no matter how quickly the page rendered. Clear headlines, benefit-led copy, and an obvious call to action all carry real weight.
- Mobile usability beyond speed: A fast-loading page that’s still awkward to navigate on a phone, tiny buttons, text that requires zooming, forms that are painful to fill in with a thumb, will still lose conversions even once load time is solved.
- Traffic quality: Conversion rate is only meaningful in the context of who’s landing on the page. A fast site attracting the wrong audience (through mismatched ads, broad targeting, or poor keyword intent) will still convert poorly, because speed can’t fix a fundamental mismatch between visitor intent and what the page offers.
The takeaway? Speed removes friction, but it doesn’t replace persuasion, trust, or relevance. The businesses that see the biggest gains are usually the ones that treat speed as one part of a broader conversion strategy, not a silver bullet on its own.
Limitations of Site Speed and Conversion Rate Research
Before drawing firm conclusions from any of the statistics in this article, it’s worth being honest about the limitations of the underlying research. Most publicly available site speed data falls into two categories: single-company case studies that reflect one business’s specific audience, product type, and infrastructure, or broad industry aggregates that combine vastly different sectors, traffic sources, and user intents into a single average.
Neither is a perfect proxy for how speed will affect your particular site.
What can be sure about?
The fact that we see a solid 132% average speed improvement across all our green hosting clients, and a 432% average speed improvement for clients who choose our performance green hosting plans at Solve.
Beyond Conversion: How Site Speed Affects SEO and AI Search
Conversion rate is only one side of the site speed story. A slow site doesn’t just lose customers once they arrive; it can prevent them from finding you in the first place. Speed now touches search rankings, AI-generated answers, and overall visibility.
SEO, Search Rankings & Core Web Vitals
It’s no secret that Google has used page speed as a ranking factor since 2010 for desktop and since 2018 for mobile. But the relationship has become far more important since then. In May 2020, Google introduced Core Web Vitals, a set of three specific, measurable signals that assess real user experience rather than lab-based test scores.
These metrics are pulled from actual Chrome user data, not simulated conditions, which means they reflect how your site genuinely performs for the people visiting it. A slow, unstable, or unresponsive site doesn’t just frustrate visitors; it can actively work against you in search rankings, making it harder for new visitors to find you at all.
Core Web Vitals Explained: LCP, INP, and CLS
Core Web Vitals break page experience down into three distinct, measurable components. Rather than relying on a single vague “speed score,” Google assesses loading performance, interactivity, and visual stability separately, since each affects the user experience differently.
LCP: Main Content Should Load in 2.5 seconds Or Less
Largest Contentful Paint measures how long it takes for the biggest visible element on the page, usually a hero image, headline, or main text block, to fully render. This is effectively Google’s way of measuring “how long until this page feels loaded” from a visitor’s perspective. Google considers 2.5 seconds or less to be a good score; slower than that, and visitors are left staring at a blank or partially loaded page during the moment that matters most for first impressions.
INP: Interactions Like “Add to Cart” Should Respond Within 200ms
Interaction to Next Paint measures how quickly a page responds after a visitor interacts with it, clicking a button, opening a menu, or adding an item to a cart. A page can look fully loaded and still feel broken if it fails to respond quickly to input. Google recommends interactions complete within 200 milliseconds; anything slower starts to feel laggy or unresponsive, which is often when visitors click again, get frustrated, or abandon the action entirely.
CLS: Layout Shift Should Stay Below 0.1
Cumulative Layout Shift measures visual stability, specifically, whether elements on the page unexpectedly move while it’s loading. This is the metric behind the frustrating experience of trying to tap a button, only for an ad or image to load in above it and shift your tap onto the wrong element entirely. Google recommends keeping CLS below 0.1; higher than that, and the page feels unpredictable and untrustworthy, even if it’s technically fast.
How Site Speed May Be Limiting Your AI Performance
AI search tools work differently from traditional search engines, changing how speed affects your visibility for AI bots. Tools like Perplexity, ChatGPT and Claude often need to retrieve and process content from multiple sources in real time, rather than relying on a pre-indexed snapshot. If your page takes several seconds to respond while competing sources return their content almost instantly, there’s a real risk your site simply isn’t included in the response.
In addition to this, a Vercel and MERJ analysis of over 500 million requests from OpenAI’s GPTBot found zero instances of JavaScript execution, meaning these crawlers only ever see the raw HTML delivered in a page’s initial response, never anything that loads in afterwards. If your site relies on JavaScript to render key content, and that content takes time to build and load, there’s a real chance AI systems never see it at all, regardless of how fast the page eventually feels to a human visitor.
This reframes site speed for the AI era: it’s no longer just about how quickly a page appears to load, but about how much of your content is present and readable the moment a crawler’s single request arrives.
What is the Average AI Referral Conversion Rate?
A study by Opollo found that AI visitors converted at an average rate of 14.2%, which is 4-5 times more than the average of 2.8% for Google Organic Traffic. It’s worth noting that this mind-blowing statistic was found in a study of 312 IT and technology service firms, and that sector-specific factors may be at play here.
However, other studies have also found that AI search referral traffic converts 22% higher than traditional organic traffic. This highlights that AI users are already further down the purchase funnel (BOFU rather than TOFU) and arrive with higher intent, as AI has narrowed down their options.
How to Make Your Site AI-Search Friendly
Since AI crawlers like GPTBot, ClaudeBot, and PerplexityBot read only the raw HTML delivered on first request, without executing JavaScript, the priority for AI visibility is making sure your most important content is present in that very first response, not loaded in afterwards. Here’s where to start:
- Serve content in the initial HTML: If your key pages rely on client-side JavaScript to render text, product details, or FAQ content, that content is effectively invisible to most AI crawlers. Server-side rendering or static site generation ensures your content is present on the page before any script runs, so it’s readable the moment a crawler arrives.
- Keep your server response fast and reliable: A crawler that receives a slow or delayed response has less content to work with in the time it allocates to your page. Solid hosting, caching, and a CDN all help ensure your HTML arrives quickly and completely, giving crawlers the best chance of capturing your full page.
- Structure content clearly: Use descriptive headings, well-organised paragraphs, and clean HTML markup. AI systems, much like human readers, extract meaning more reliably from logically structured content than from dense, unstructured blocks of text.
- Avoid gating key content behind interactions: Content hidden behind tabs, accordions, “load more” buttons, or hover states that require JavaScript to reveal may never be seen by a crawler that isn’t executing scripts in the first place.
- Check your robots.txt and server logs: Make sure you’re not accidentally blocking AI crawlers like GPTBot or ClaudeBot if you want to appear in AI-generated answers, and review your logs periodically to see which bots are visiting and whether they’re receiving fast, complete responses.
Ultimately, the businesses most likely to be cited by AI search tools will be those that treat crawlability as seriously as they treat traditional SEO, ensuring the content of a page isn’t locked behind rendering steps that only a human browser can complete.

How to Assess Your Site’s Speed and Load Time
Before you can fix a speed problem, you need a clear, accurate picture of where your site actually stands, which means looking beyond a single “score” and understanding both lab and real-world data.
Leading Tools for Site Speed Analysis
- PageSpeed Insights: The natural starting point, since it’s free, widely trusted, and shows both lab-based performance metrics and real user Core Web Vitals data pulled from Chrome users who’ve actually visited your site. It also breaks down specific opportunities for improvement, from image optimisation to render-blocking resources.
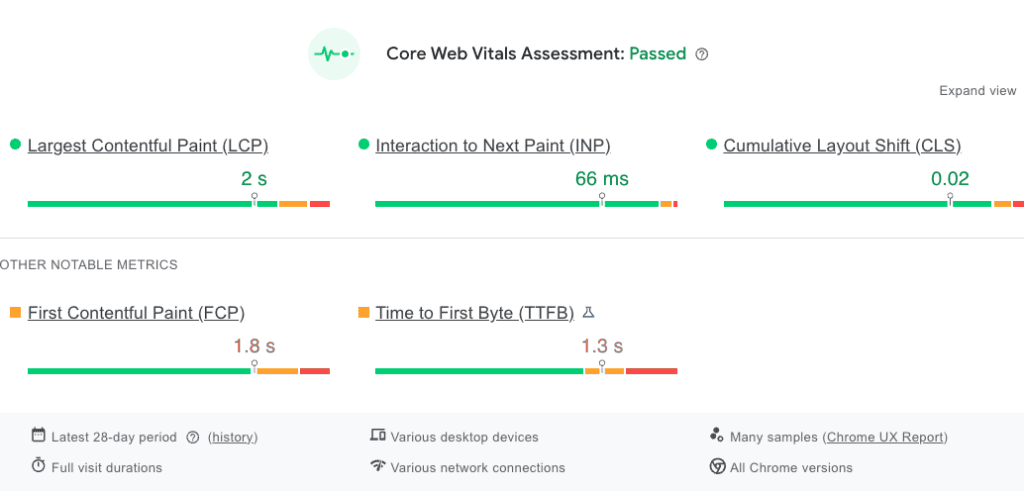
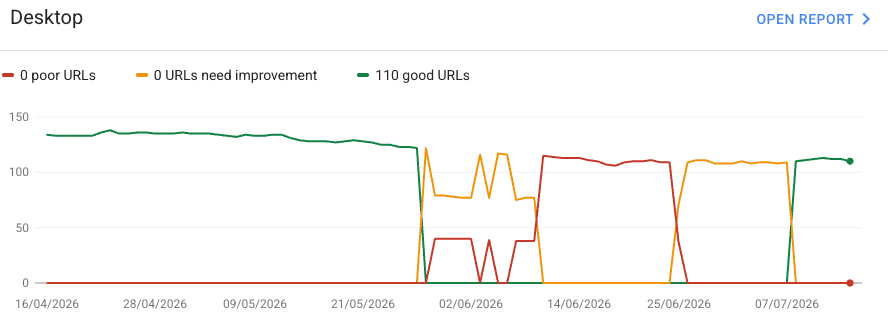
- Google Search Console’s Core Web Vitals report: takes this further by showing performance trends across your entire site over time, grouping pages by URL pattern so you can spot systemic issues rather than testing one page at a time.
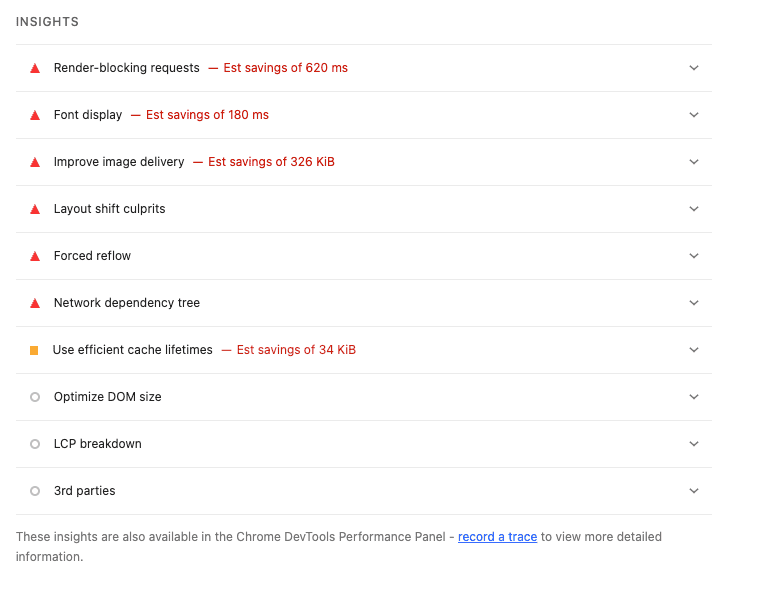
- Lighthouse, built into Chrome’s DevTools, is useful for quick, on-demand testing during development, though it’s worth remembering this is lab data collected in a controlled environment, so it won’t always match what real visitors experience on varied devices and connections.

- GTmetrix offers more granular technical details, including waterfall charts that show exactly which resources are slowing a page down, which are useful once you’ve identified a problem and need to diagnose the specific cause.

It’s worth noting that desktop and mobile performance will have different scores. The goal isn’t to chase a perfect 100/100 score; it’s to identify the specific, real-world bottlenecks that are actually costing you visitors and conversions, then prioritise fixing those first.
How to Speed Up Your Site: Proven Strategies
Most speed problems come down to a handful of well-understood fixes.
Optimising images, compressing files, switching to modern formats like WebP or AVIF, and lazy-loading anything below the fold is usually the fastest win, since images are typically the biggest contributor to page weight. Other strategies include:
- Streamlining your code by minifying CSS and JavaScript
- Leveraging browser and server-side caching
- Auditing plugins regularly, deleting anything unused rather than just deactivating it
- Using lightweight, well-maintained tools over feature-heavy ones
None of these fixes requires a full rebuild, but tackling them systematically, starting with whatever your speed audit flagged as the biggest bottleneck, tends to produce far better results than chasing a single silver-bullet fix.
Choosing a Web Host for Better Site Speed
Even the most optimised website will underperform if it’s sitting on slow, overloaded hosting, since hosting sets the floor for how fast your site can possibly be. At Solve, our green hosting plans are built specifically to solve this problem.
We deliver an average 132% speed improvement across our clients, with performance-tier plans seeing improvements of up to 432%.
Every plan is powered by 100% renewable energy and includes free, zero-hassle migration. Beyond raw speed, our hosting is built around the factors that actually move the needle for a business: enhanced image optimisation, advanced caching, a premium CDN on our higher-tier plans, 24/7 site monitoring and enhanced uptime management.
All of which translate into a faster, more reliable site that converts better, ranks higher, and shows up more reliably in AI-powered search.
For ecommerce, booking, or other revenue-critical sites, our Ultrafast Performance and Critical plans add dedicated resources and premium CDN as standard, ensuring your site stays fast even under heavy traffic, when speed matters most.

Spending time and budget driving traffic to a site that can’t hold onto it? That’s a speed and conversion rate problem.
Speak to our MD, Perry, today.
Frequently Asked Questions
What tools can I use to analyse site speed and its impact on user conversion?
PageSpeed Insights and Search Console’s Core Web Vitals report are the best free starting points, covering both lab and real-user data. GTmetrix and WebPageTest add deeper technical detail. You can then pair this data with Google Analytics, which shows how load times directly affect your bounce and conversion rates.
Which web hosting services offer the best site speed to improve conversion?
Look for hosts offering SSD storage, built-in caching, a CDN, and data centres located close to your audience. Managed hosting providers like Solve are built specifically for performance, offering measurable speed improvements designed to reduce bounce rates and increase conversions.
What are the best optimisation services to increase site speed and boost conversion for e-commerce?
The most effective services combine image and code optimisation with advanced caching and CDN delivery, since ecommerce sites need consistent speed even under heavy traffic. Managed performance hosting, like Solve’s Ultrafast Performance plans, is built specifically to handle this.